Visualizing Stock Market Data with Python
Building an Interactive Stock Market Web Application using Django, Pandas, and Streamlit
Building an Interactive Stock Market Web Application using Django, Pandas, and Streamlit
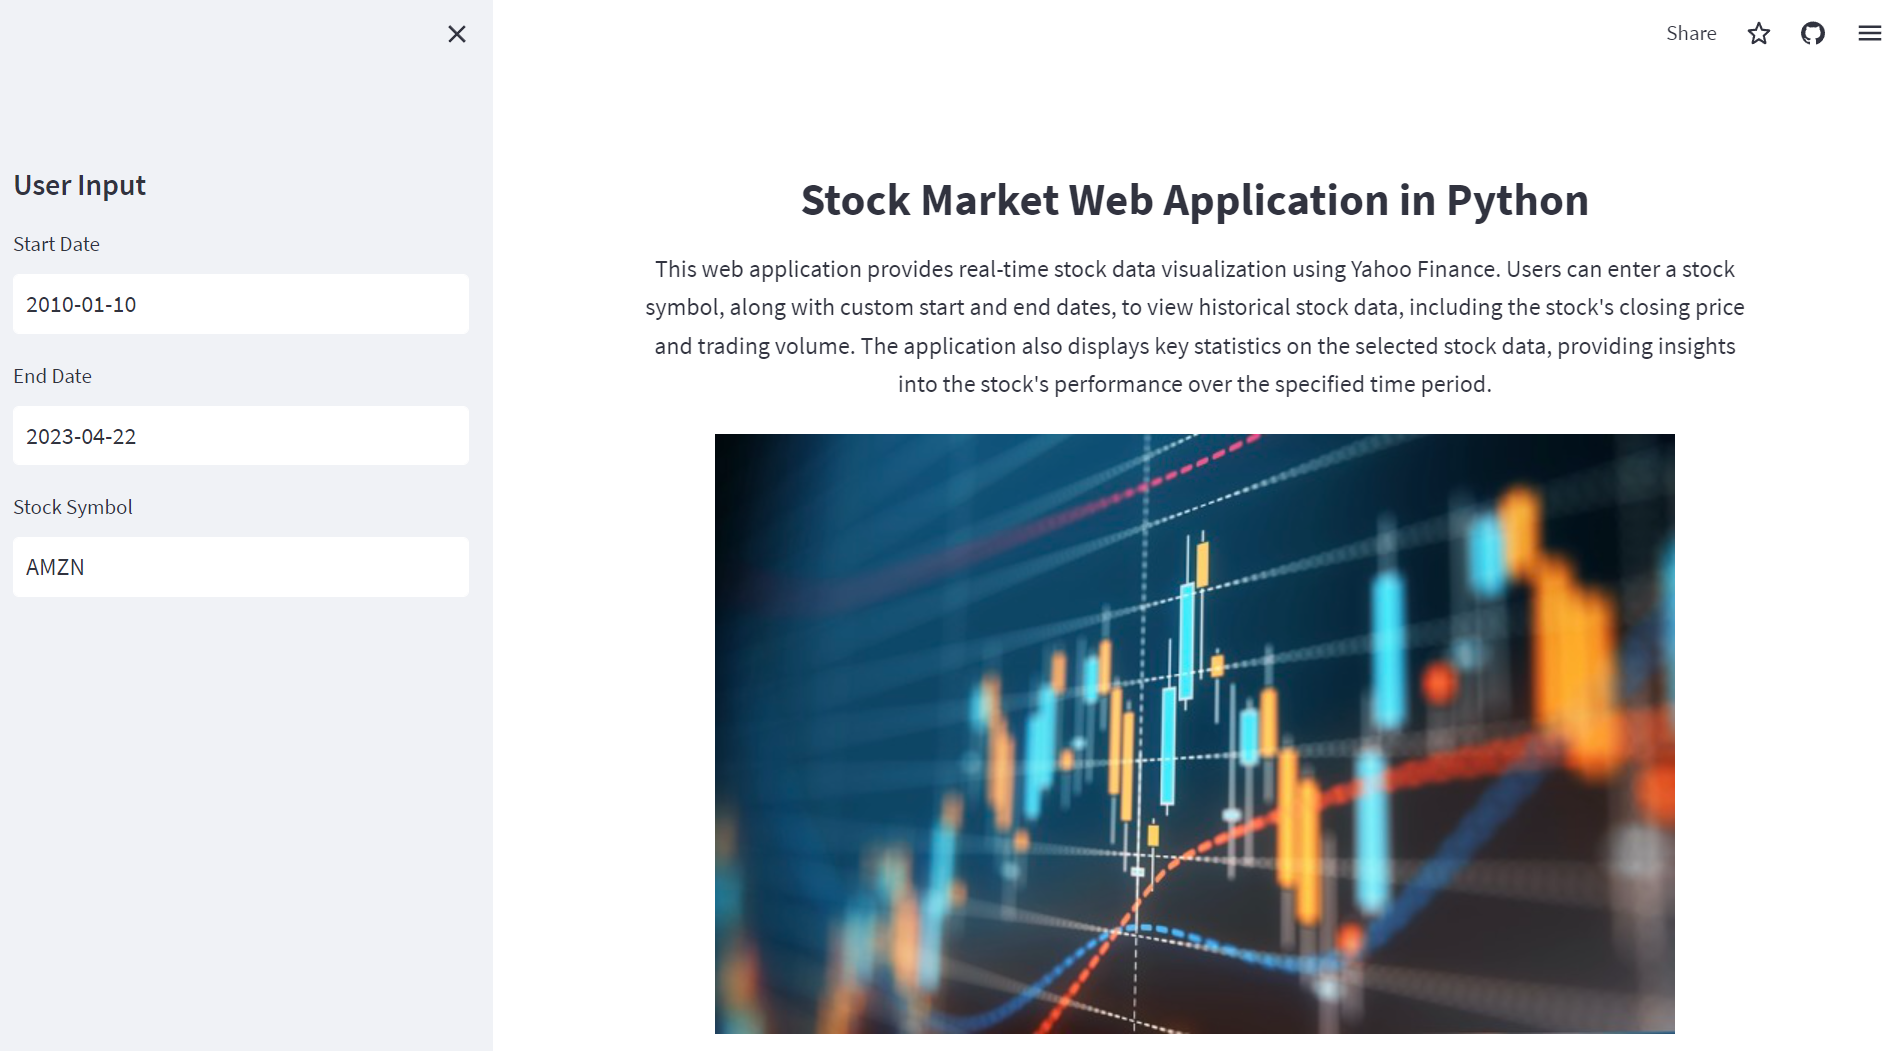
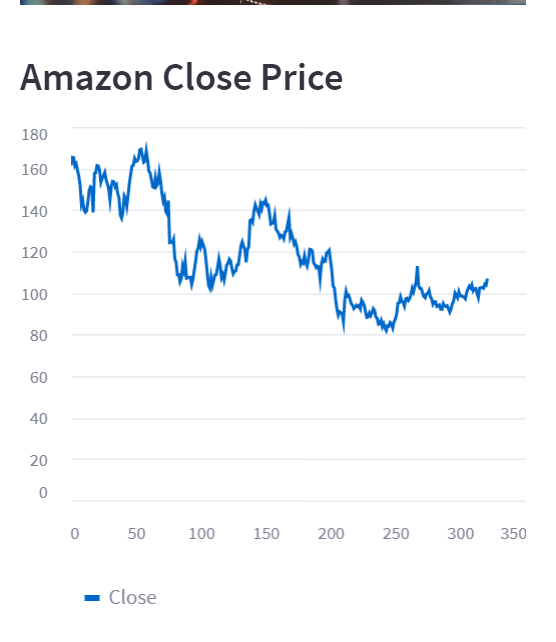
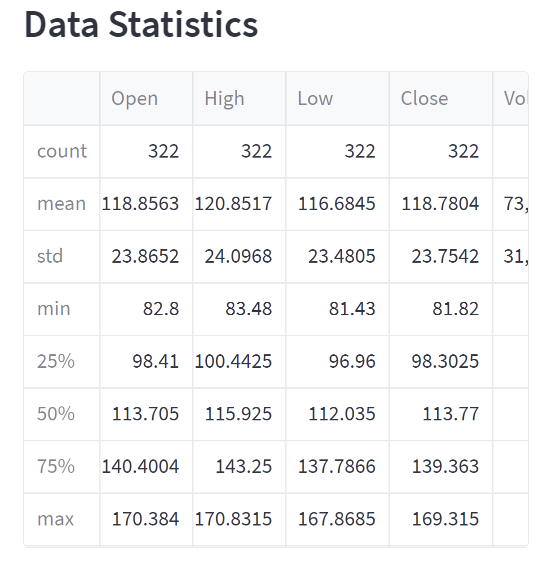
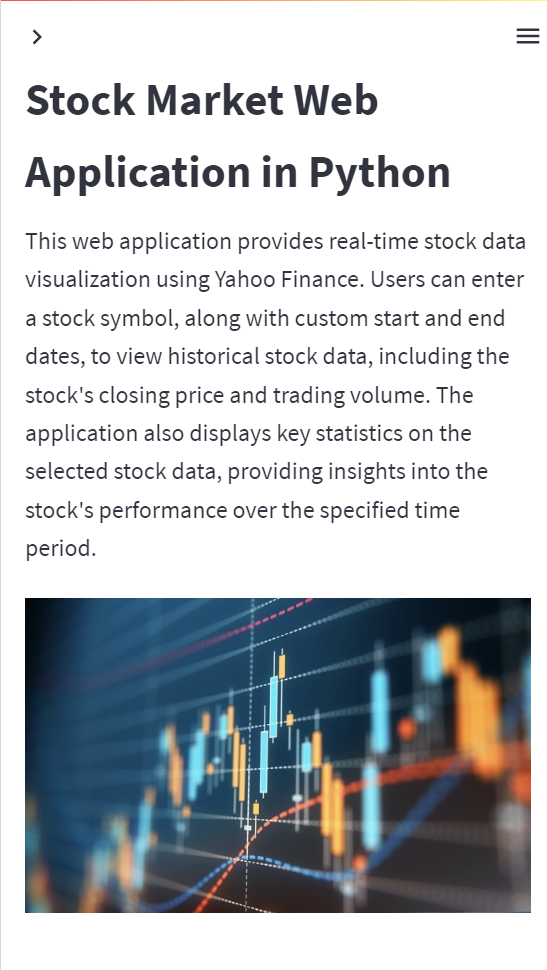
In this blog post, we will explore the creation of a stock market web application using Python and the Streamlit library. This application allows users to visualize real-time stock data, including historical stock prices and trading volumes, by entering a stock symbol and specifying custom date ranges. Additionally, the application displays key statistics on the selected stock data, providing valuable insights into the stock's performance over the specified time period.
Technologies Used:
Python: Python is a versatile and widely-used programming language, popular for its readability and ease of use. In this project, we have used Python to build the backend of our stock market web application.
Streamlit: Streamlit is an open-source Python library that makes it easy to create custom web applications for machine learning and data science projects. It allows developers to build interactive, data-driven applications with minimal effort. In this project, we have used Streamlit to create the frontend of our application and interact with the user.
Yahoo Finance API: Yahoo Finance API is a service that provides access to historical and real-time financial data. We have used the 'yfinance' Python library to fetch stock data from Yahoo Finance API for the specified stock symbols and date ranges.
Pandas: Pandas is a powerful data manipulation library for Python. It is used to clean, analyze, and transform data into the desired format. In this project, we have used Pandas to process the stock data fetched from Yahoo Finance API.
PIL (Python Imaging Library): PIL is a Python library used for opening, manipulating, and saving many different image file formats. We have used PIL to load and display images in our web application.
Demonstrated Skills:
Data fetching and processing: This project demonstrates the ability to fetch stock market data from an external API (Yahoo Finance) and process it using Pandas to derive insights and visualize the data.
Web application development: The project showcases the skills needed to create a web application from scratch using Python and Streamlit. It involves designing the frontend, handling user input, and presenting the processed data in a visually appealing manner.
Responsive design: The project highlights the importance of responsive design in web applications, ensuring that the application is accessible and visually appealing on a wide range of devices, including mobile phones and tablets.
Conclusion:
In this blog post, we have discussed the process of creating a stock market web application using Python and Streamlit. This project demonstrates the power and versatility of Python and its libraries in fetching, processing, and visualizing real-time stock market data. By leveraging these technologies, you can build interactive, data-driven applications for your portfolio, showcasing your skills in web development, data processing, and visualization.
🔗 GitHub repository: https://github.com/peterpapas/stock_market_web_app
🔗 Live version: https://peterpapas-stock-market-web-app-stock-app-7fvimd.streamlit.app/
GitHub repository:
Live version: